Do you like graphs, statistics and reports? So take advantage of our Summaries. You can easily find out which activities have too high costs or which are the most profitable.
Thanks to time tracking you can see how effective your team or you are. Click Reports in the top blue bar > Summaries in the Reports section.
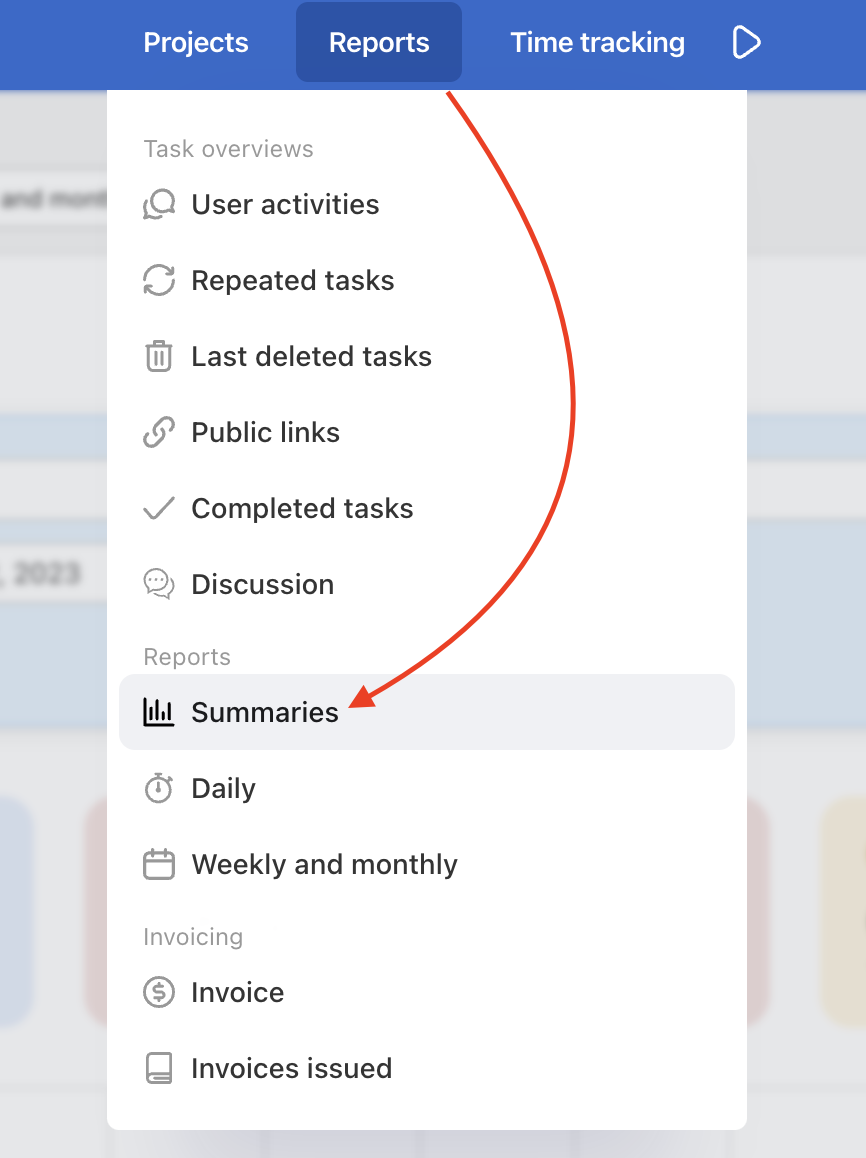
Chart view
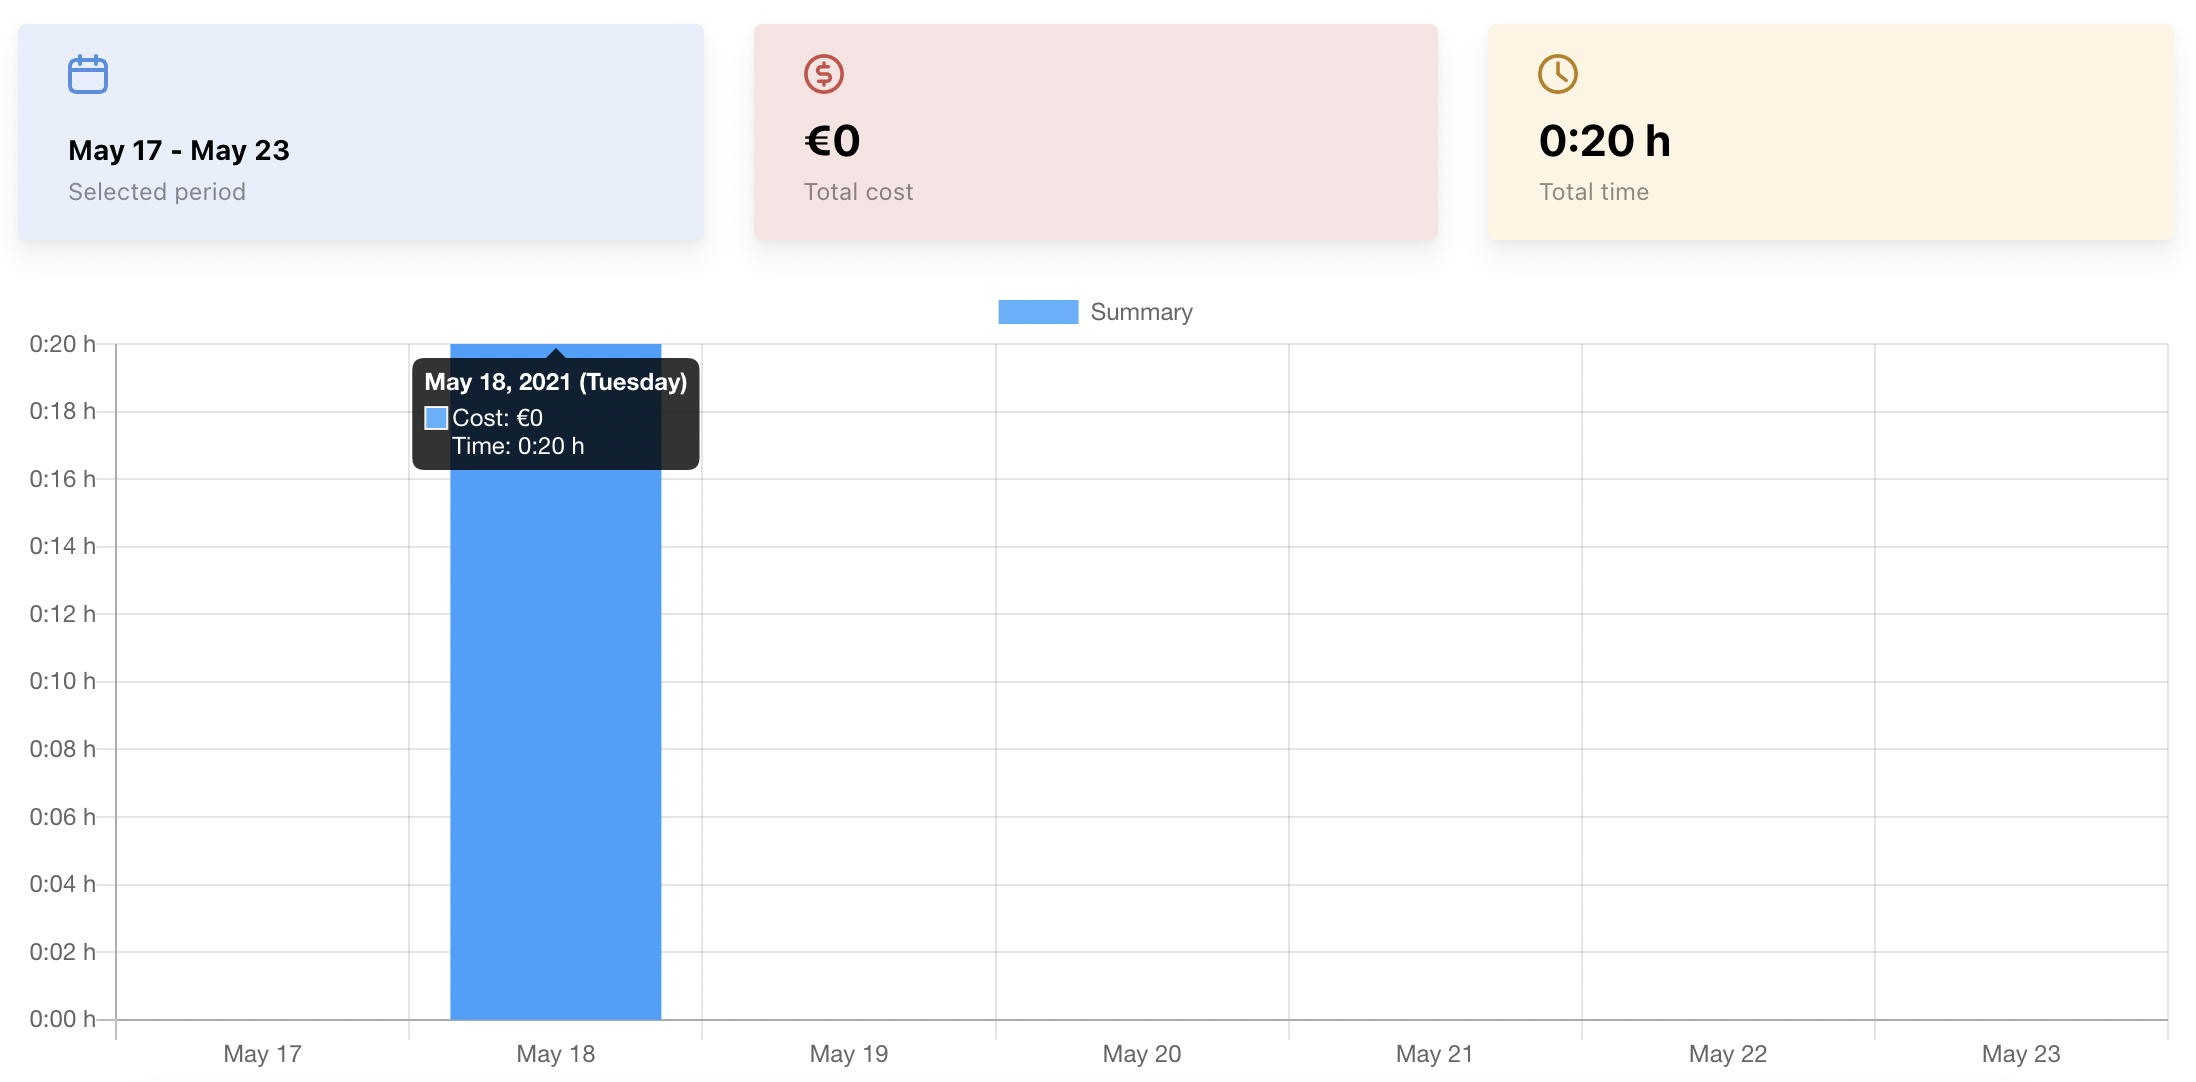
In the top part find a bar chart overview of reported time and finances per selected time period. Use filters for users, projects, task labels, time or project currency and get exactly the view you need.
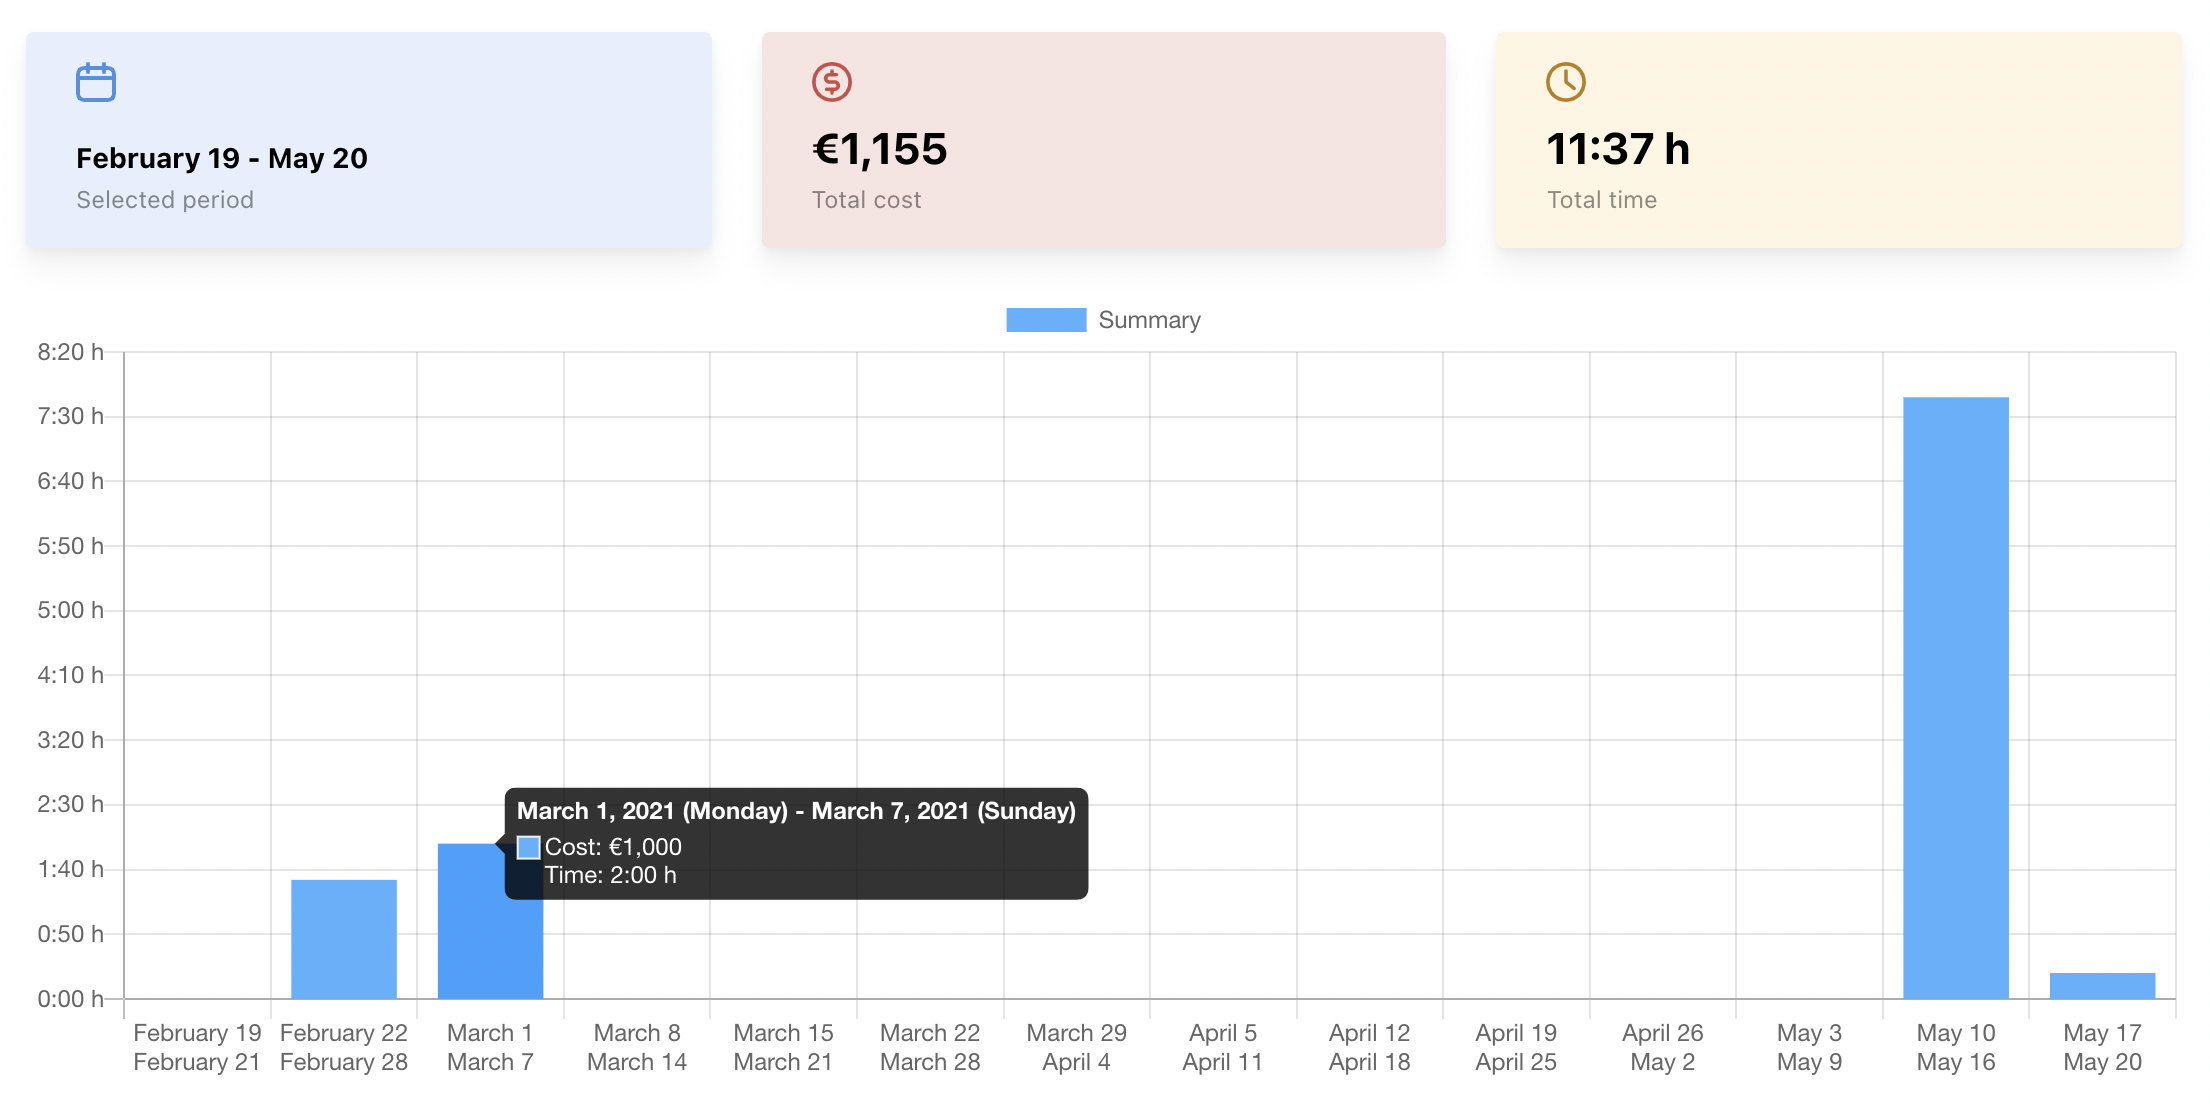
When having the mouse over the particular bar you can see costs and time per month/day.
Filter summaries
Clear filters in the summaries ensure that you see exactly the data you need to see. You can filter in summaries in the following ways:
- By users – if users haven’t any report in Freelo, you will not see them in the filter
- By projects
- By task labels
- By time period
- By currency
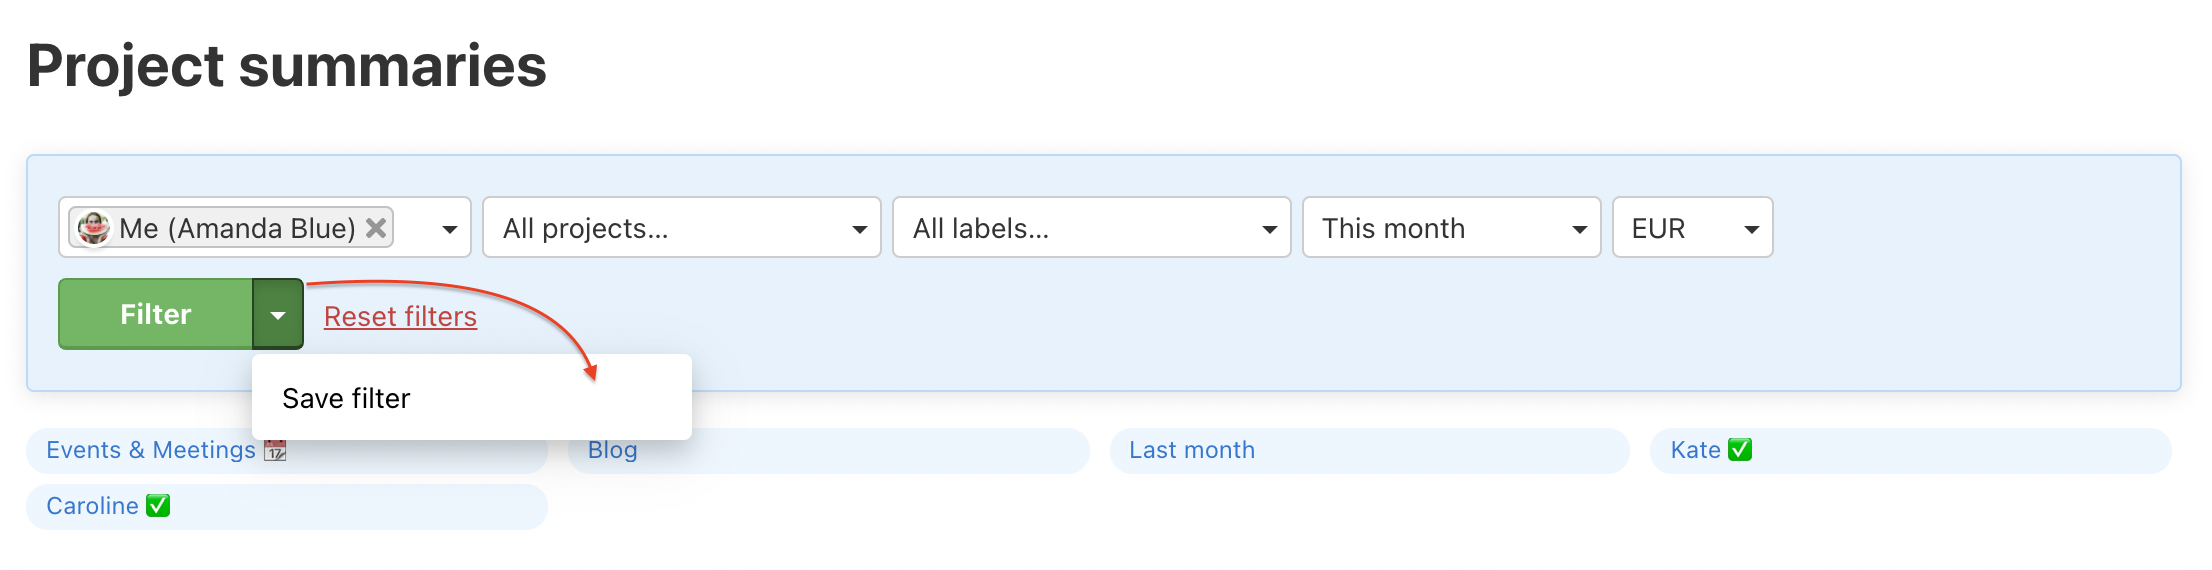
Save filters
Set up filters and save them for next time. Filters can be edited and ordered. Click the arrow icon next to the green button Filter > Save filter > input the name of filter and Save as new filter.
We do recommend saving the filter for any report you have to check regularly.
Delete your filters by clicking on the cross at the filter.
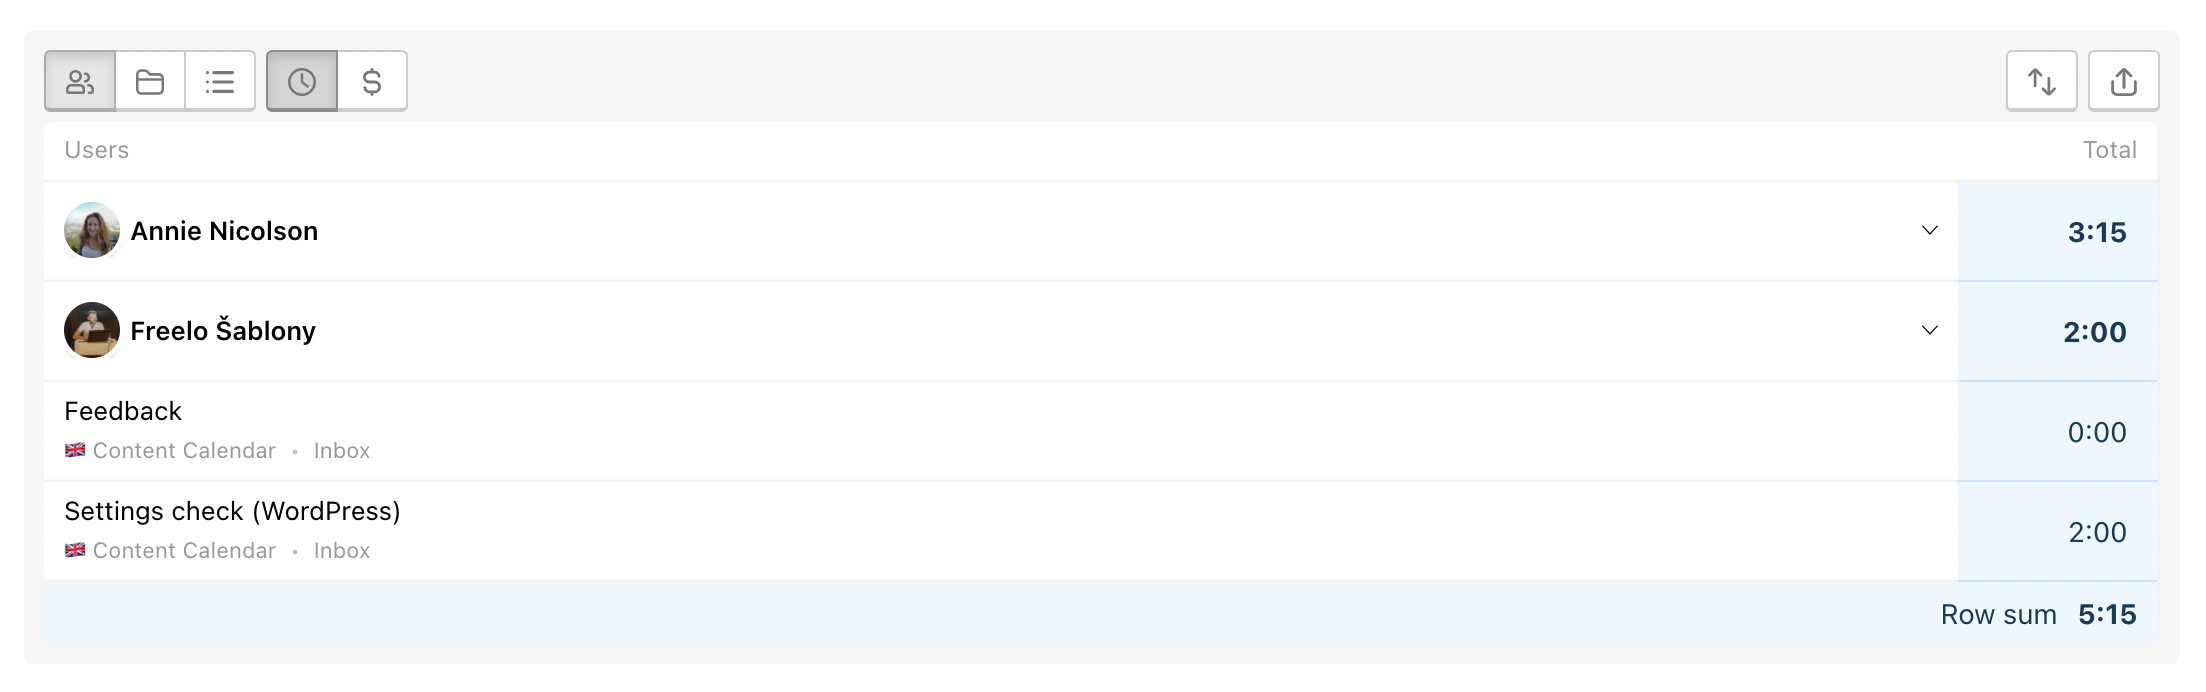
Table view
Overview of filtered summaries can be viewed also as a table, where you can set other perspectives. Just scroll down below the chart.
Similar and more detailed summary overview is in section Weekly and monthly reports.
Select view
- According to user
- According to project
- According to To-Do list
- Reported time
- Reported money
[/ht_message]
Select sorting
There is also the possibility to line up the data per newest/oldest reports or alphabetically.

Export to CSV
Anything you filter can be downloaded as a CSV file that you can open in Excel or any other chart editor. Click the icon in the top right corner Export.
